How to be as interesting as a video game

Friday, October 13, 2017 No comments
Image result for gamification
1. Realize self-directed learning not by merely suggesting it, but making it necessary to get anything done.
2. Design learning experiences so that students see visible progress on a daily basis.
3. Make objectives clear, and offer students multiple ways to accomplish them.
4. Give students the tools to design and build what you hadn’t thought of.
5. Design with iteration in mind: one skill builds on the next, and students need it all to succeed.
6. Use project-based learning where students design the entire process from brainstorming to publishing.
7. Give students malleable learning tools and resources that they can customize, or “upgrade” to fit their approach to learning.
8. Make learning both collaborative and competitive.
9. Consider challenge-based learning and place-based education, where students solve problems important to them, in communities that are watching.
10. Gamify your classroom in a way that focuses not on standards, data, or “proficiency,” but personal progress meaningful to the student.
Ideas from Terry Heick

Examples of Learners Creating and Problem Solving With Technology

Wednesday, October 11, 2017 No comments


Tech Tools that Rock

Friday, August 4, 2017 No comments
The following tools can be manipulated by you and then saved. The saved files can then be inputted into your Promethean Flipcharts and/or Smart Notebook files. To learn more about making your own games click here.

Once on the website for each tool, click on Sample at the bottom of the screen to see lesson ideas. The icon looks like this: 


This is a simple activity which is a great way of rounding off a unit and revising important dates, concepts and people. It can also be used to randomly pick a name from a list of students. You can copy and paste your data direct from Word, Excel and other programs. 

This is a powerful interface: you create one set of questions, then you can choose from four different interactive quizzes.

This is a great interactive clock to help with classroom management.

A Dustbin game is great for helping students to organize ideas into categories.

PostIt is a useful tool for helping students to identify and then categorise key factors. Each "Note" can be dragged and dropped anywhere in the screen and colour coded if necessary. A background image can also be inserted for annotation purposes.

This activity allows students to input their words into a book that becomes virtual and exciting.

A fishbone template is an essay planning tool. Whereas the burger diagram encourages students to think in terms of introduction, three main sections and a conclusion, the fishbone approach involves selecting four main factors, then providing three key pieces of detail about each.

A burger diagram is a simple essay planning tool. Students make basic notes covering their introduction, three main sections, and a conclusion.

The Jigsaw template is designed to allow students to make connections between various factors in an engaging manner.

The Priority Chart Template allows students to brainstorm factors which help to answer a key question, and then these can be dragged and dropped into an order of priority and colour coded as required.


32 Characteristics of High-Performing Classrooms

Wednesday, July 26, 2017 No comments

Technology Integration
  1. Technology connects students with authentic content and communities
  2. Personalized learning experiences are achieved through a variety of mobile, game-based, or self-directed learning
  3. Technology creates learning opportunities impossible without it
  4. Technology is a means, not an end
Cognitive Demand
  1. Rigor is omnipresent, from bell ringers and quizzes to accountable talk and assessments
  2. Students generate original ideas from seemingly disparate sources of information
  3. Students consistently revisit ideas, thinking and general misconceptions (e.g., via digital portfolio)
  4. Thinking habits are valued over demonstrated “proficiency”
Lesson Planning
  1. Lesson planning templates serve student thinking, not district “non-negotiables”
  2. Bloom’s taxonomy (or related learning taxonomies) is/are used to move students from basic to complex thinking daily
  3. Data is applied immediately and meaningfully to revise planned instruction
  4. There is clear evidence of backwards design
Assessments
  1. Transfer is required to prove mastery
  2. Data is easily extracted and visualized
  3. The academic standard and assessment form complement one another
  4. There is opportunity for students to demonstrate what they do know rather than simply succeed or fail in demonstrating what the assessment asks for
Curriculum Mapping
  1. Curriculum naturally absorbs and adapts to data sources
  2. Curriculum map is dynamic, changing in response to data and circumstance
  3. There is clear priority of academic standards (not all standards are created equal)
  4. There is clear evidence of the Gradual Release of Responsibility model
Learner Choice
  1. Student questioning–rather than the teacher’s–drives learning
  2. The ability for self-directed learning extends beyond the topical, to assessment forms, research sources, learning technology, topics, and essential questions
  3. Learning pathways can be self-directed by ambitious, supported, and/or resourceful students
  4. Students recognize and can articulate their own role in the learning process at any given time
Classroom Management
  1. Expectations are clear 
  2. Discipline is a collective effort: peers, colleagues, administration, and family
  3. Fair doesn’t always mean equal
  4. “Behavior” starts with self-awareness and self-respect, which must be encouraged and modeled
Student Support
  1. Students have choice in demonstrating understanding
  2. There are exemplar models immediately accessible to students of all important work and activities
  3. Students are accountable to peers, families, organizations, and communities, not you
  4. Student literacy levels are meaningfully taken into account when planning instruction 
32-characteristics-of-high-performing-classrooms
Image attribution flickr user flickeringbrad; 32 Characteristics Of A High-Performing Classroom

Star Chart - The Stars Come Alive

Monday, February 27, 2017 No comments

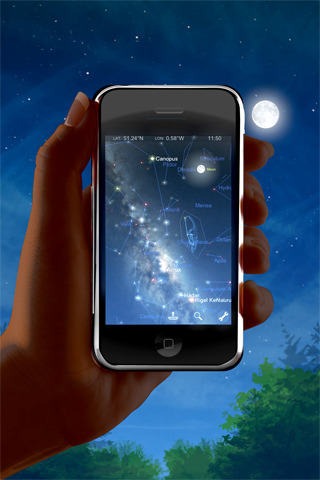
I want to say a special "Thank You" to Mike Lee at EdShelf for posting the below about StarChart. It is such a great tool and not only fun for you and your students, but for your own kids as well. I am so excited that this app is FREE! Yes I said it...FREE! I hope you enjoy it as much as I do. Bring the love of astronomy to your classroom and to your family.


Image result for star chart app


Star Chart is now FREE! The top educational & augmented reality astronomy app – download and find out why over 20 million people use Star Chart!
You can now have a virtual star chart in your pocket. Look through the eyes of your iPhone or iPad* to see a high-tech window into the whole visible universe.
All you have to do is point your AR enabled device* at the sky and Star Chart will tell you exactly what you are looking at.
Using state of the art GPS technology, an accurate 3D simulation of the visible universe, and a great deal of technical wizardry, Star Chart calculates – in real time – the current location of every star, planet and moon visible from Earth and shows you precisely where they are; even in broad daylight!

Image result for star chart app
Want to know what that bright star is called? Point your device* at it – you might just find out it’s a planet!
Want to know what the night sky looks like to people on the other side of the earth? Well just point your device down!
Want to know where your star sign is in the sky? Star Chart will tell you all this and more.
Image result for star chart app
Star Charts features include:
  • Just point and view. When you hold your device up to the sky, Star Chart will automatically start tracking your movements to match the sky *.
  • Alternatively, look around the sky using finger gestures – perfect for armchair astronomers!
  • In a single app of less than 30MB, Star Chart dynamically scales its visuals and capabilities across all iOS devices to meet the high end capabilities of a retina display iPad while also running smoothly on the earliest iPhones and iPods.
  • Accurately depicts all the visible stars of the northern and southern hemispheres – a total of approximately 120,000 stars!
  • Fly to and explore all the planets of the solar system, their moons and the sun all rendered in beautiful 3D with state of the art visual effects.
  • Using the powerful Time Shift feature, simply tap the time button and smoothly shift up to 10,000 years forward or backward in time.
  • Displays all 88 constellations, with constellation imagery based on the beautiful artwork by 17th century astronomer Johannes Hevelius.
  • Includes the complete Messier catalogue of 110 exotic deep sky objects.
  • Tap on anything in the sky and get the facts on what you are looking at, including distance and brightness.
  • Very powerful zoom function, lets you view the sky in extra detail, using intuitive finger gestures.
  • Fully configurable. Star Chart displays only the sky objects that you are interested in.
  • Allows you to view the sky underneath the horizon. So now you can see where the sun is, even at night!
  • Manually set your location to find out what the sky looks like from anywhere in the world.
  • Supports dynamic device orientation viewing. Allows you to view the night sky whilst holding your iPhone/iPad* at any angle.
So point your iPhone/iPad* at the sky and see what’s out there!
* Augmented Reality mode is available on devices that include a built-in compass. Manual scrolling is supported on all other devices.
Star Chart is published by Escape Velocity Ltd and developed by Escapist Games Ltd. We update Star Chart regularly, so please send us your feedback and feature requests to starchart@escapistgames.com.

Celebrate Digital Learning Day With Your Students!

Thursday, February 23, 2017 No comments
Thank you Gooru for these wonderful resources for Digital Learning Day!

Hi all it is Thrusday, February 23rd and it is Digital Learning Day!! A big shout out and thank you to Gooru for these wonderful resources to help students mindfully establish a positive digital footprint.

Click on the image below to link to the collection of resources.


If you are excited about the resources from Gooru, you should also check out the resources on Daylight Savings Time. 


Where Did Daylight Savings Time Come From?


Did you know that Daylight Savings Time was first implemented during World War 1 by Germany, Britain and eventually North America? Daylight Savings Time helped save fuel costs at a crucial time during the war. Here is a resource you can share with your students to learn more about Daylight Savings Time. 


February Tech Calendars

Tuesday, February 21, 2017 No comments
Hello and Happy Tuesday!! It has surely been a busy year already and I am working hard to get back to my blogging. Many of you know my love for Tech with Tia and her wonderful monthly calendars, so why not share her February ones (sorry its a bit late).

I hope you enjoy them as much as I do.

Picture

Picture